A student records the temperature of a cup of tea as it cools. The results are shown in the graph.
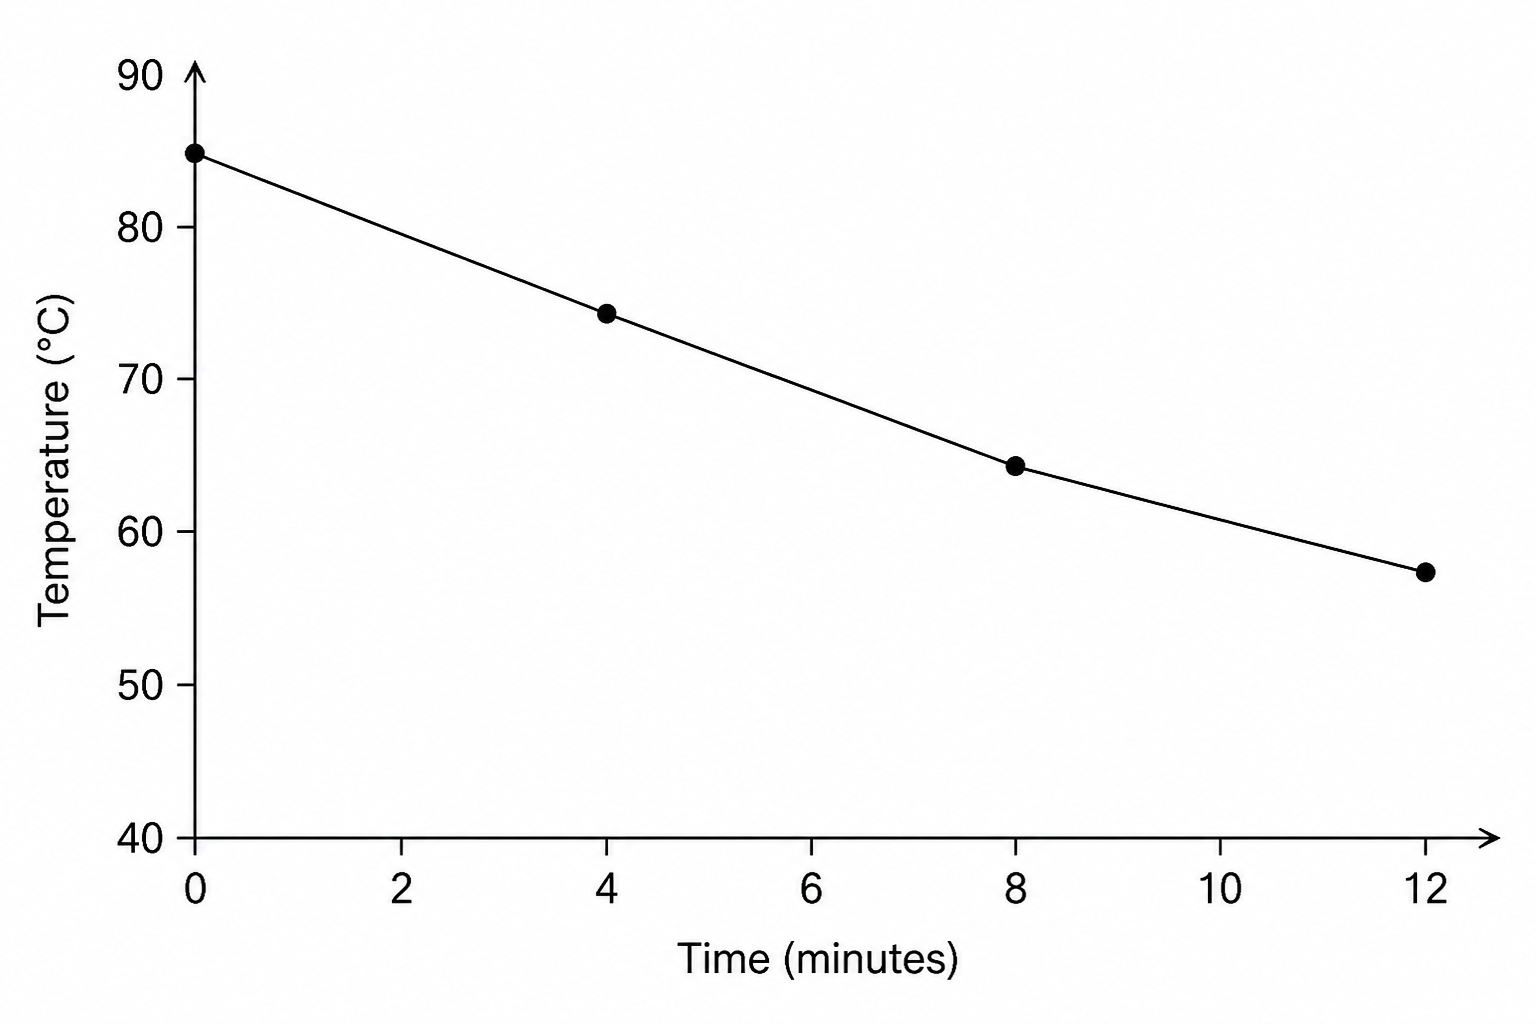
State the temperature of the tea at 8 minutes.
Marking your answer...
This may take a few seconds
Sign up for free to see your full marking breakdown and personalised study recommendations.
Create Free Account Log inThis is a free VCE Units 1 & 2 VM Numeracy practice question worth 1 mark, testing your understanding of Visualising change with graphs. It falls under Relationships in Unit 1: VM Numeracy Unit 1. Submit your answer above to receive instant AI-powered marking and personalised feedback.
In Unit 1 students will develop their numeracy practices to make sense of their personal, public and vocational lives. They will develop mathematical skills with consideration of their local, community, national and global environments and contexts, and an awareness and use of appropriate technologies. These units provide students with the fundamental mathematical knowledge, skills, understandings and dispositions to solve problems in real contexts for a range of workplace, personal, further learning and community settings relevant to contemporary society.
In this area of study students will recognise, understand and represent simple patterns of relationship and change in mathematical terms where it exists in common and familiar contexts and applications. They should be able to recognise when change is occurring, be able to identify common and simple mathematical relationships and variables, and apply the most appropriate process or processes to determine the results of change.
representation and visualisation of change such as tables, simple charts or graphs
StudyPulse has thousands of VCE VM Numeracy questions with full AI feedback, mark breakdowns, progress tracking, and study notes across every Key Knowledge point including Visualising change with graphs.